Smart Way to Learn and Practice on Technical Chart Reading...
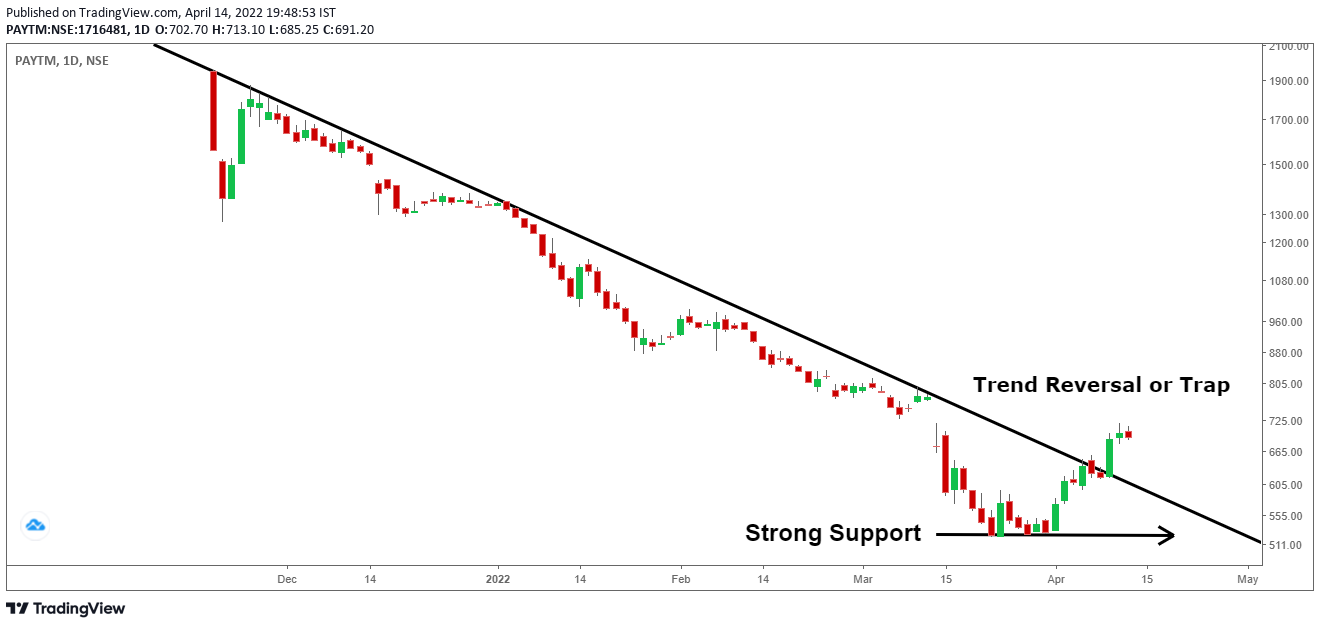
Paytm Chart Analysis -- Trend Line Reversal Signal
As we know Paytm is falling from the first day of listing it has trapped so many retail investors who bought it in the greed of listing gain. After listing at Rs 1950 it moves down to Rs 5
View Chart...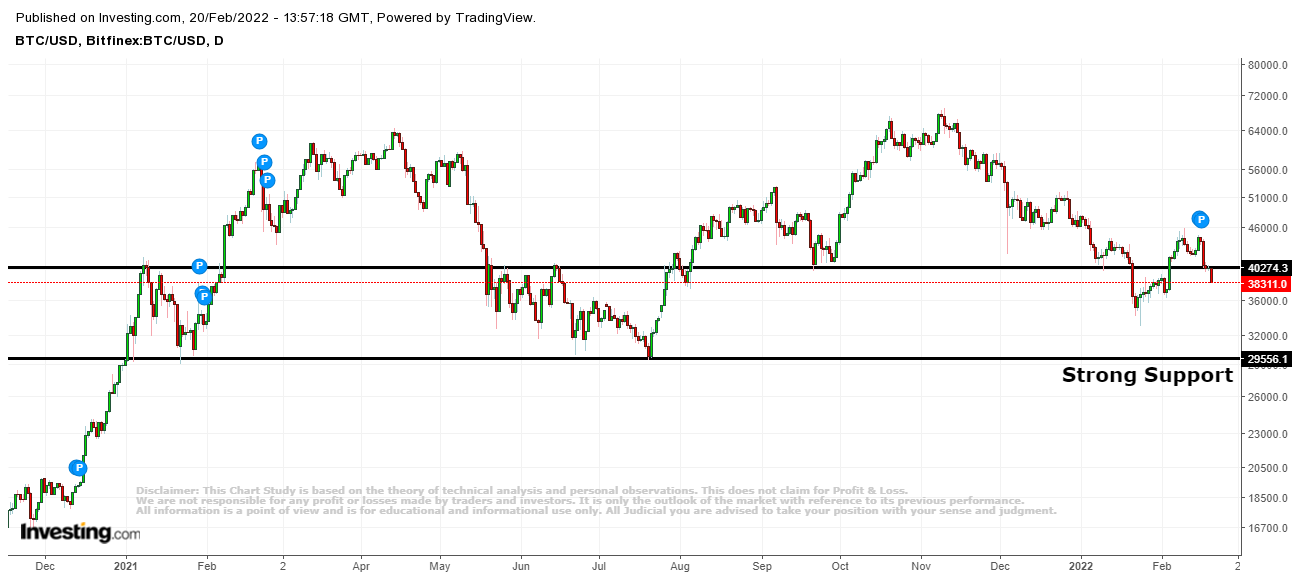
Is Bitcoin Time Over ? Why Cryptocurrencies are Drilling the Ground?
As we have seen a huge rally in cryptocurrencies which attract most people, especially youth. Our youths are crazy to invest in Cryptocurrencies especially in coins because they are very c
View Chart...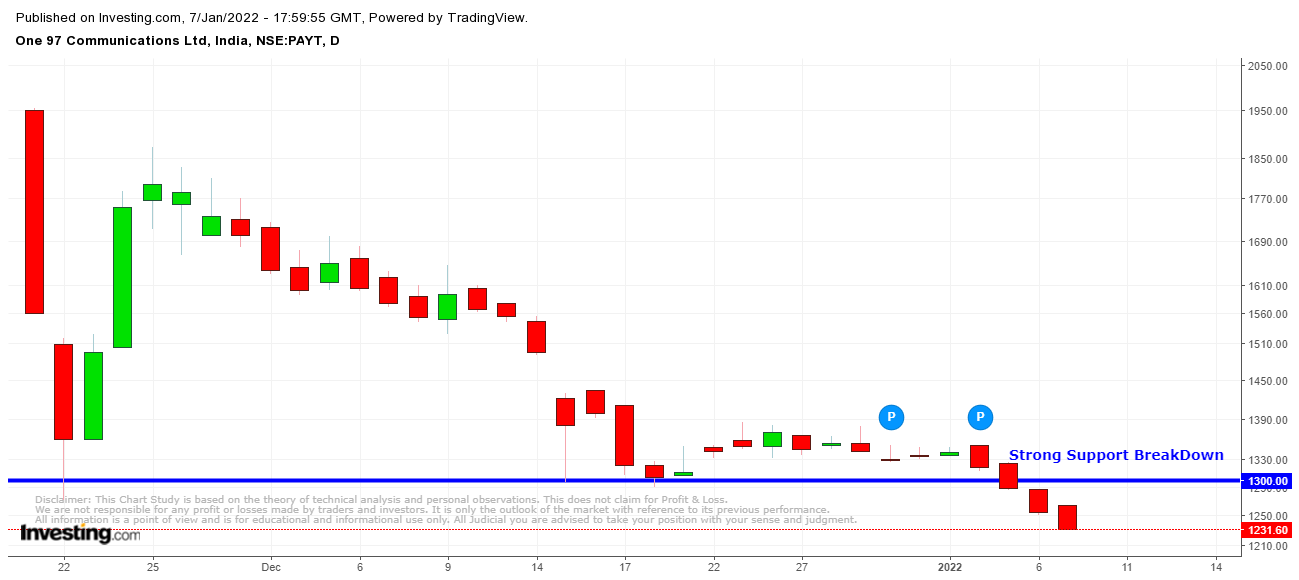
Retailers are trapped in Paytm Share. Now What's Next ?
As we know last year was the year of IPOs people have earned well in IPOs listing but one of the famous IPO listings has trapped the retailers badly and the name of that IPO is PAYTM.
View Chart...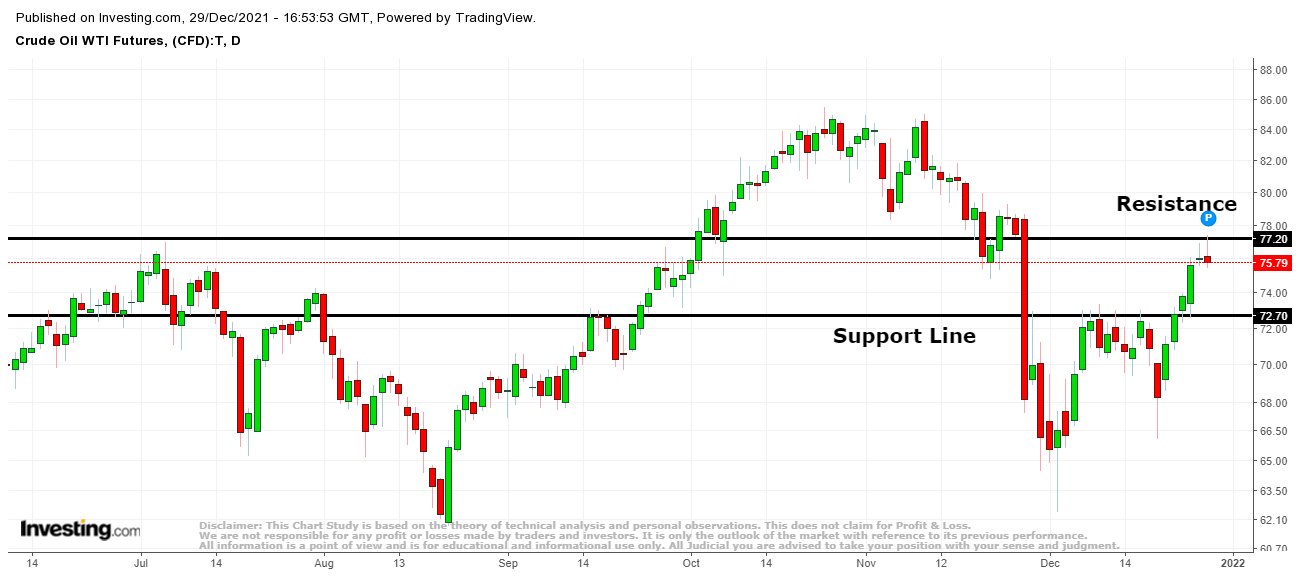
Crude Oil Chart Analysis - For the Last Two Day Update of 2021
Now we will discuss Crude Oil Chart as we have seen a rally in the last 6-7 days currently it is working near 75.7 Dollars (at the time of Analysis). A straight rally from 66.11 to 77.3 Do
View Chart...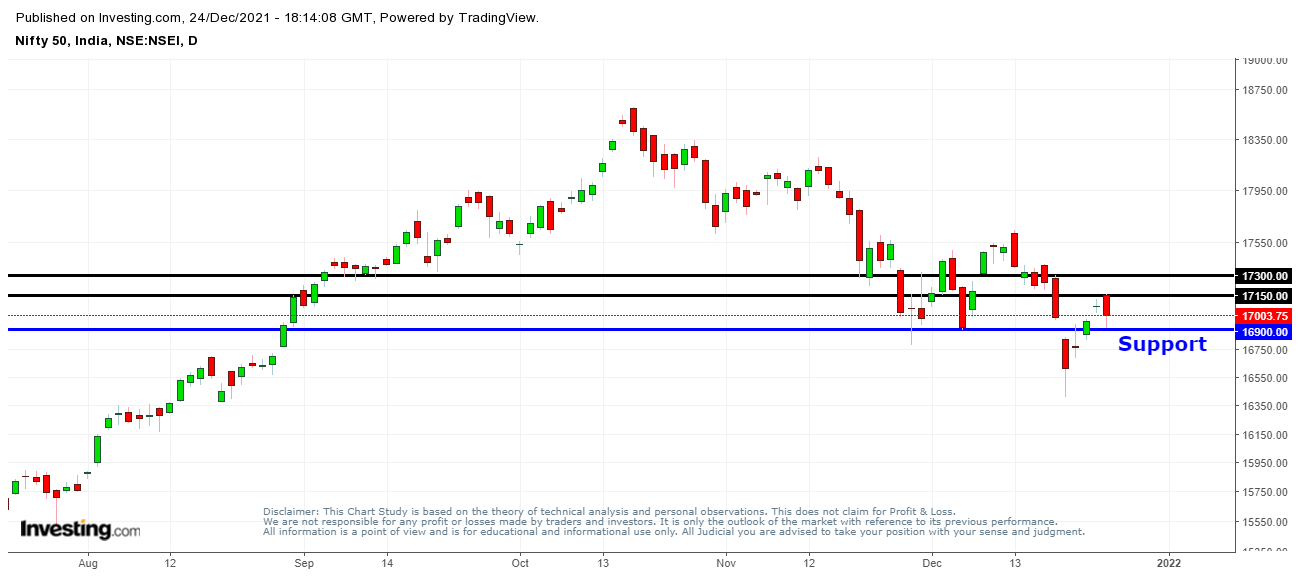
Don't Forget To Read - Nifty Chart Analysis For Upcoming Monday 27-12-2021
Today we will discuss on the chart of Nifty as you have seen in the last week we saw a fall in Nifty on Monday in which there was a downside movement of 500 points, after that, there was a
View Chart...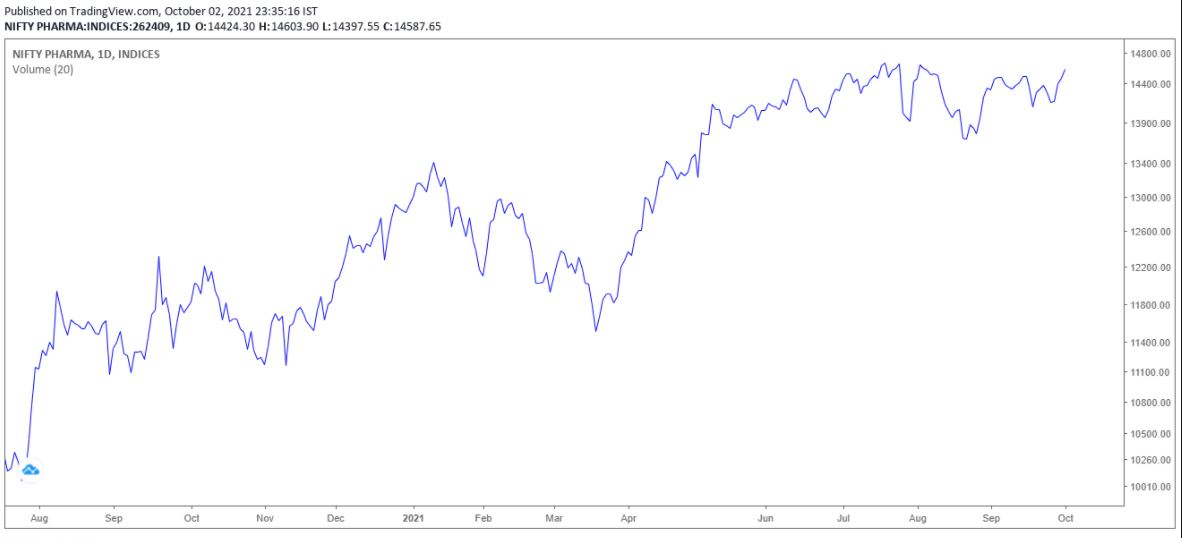
Which Sector may Outperform in October Series? You Should Know before Others
As we know Nifty has given a return of 2.84% in the month of September but we have returned 321 points from high in nifty in the last week of September, in which the biggest contribution i
View Chart...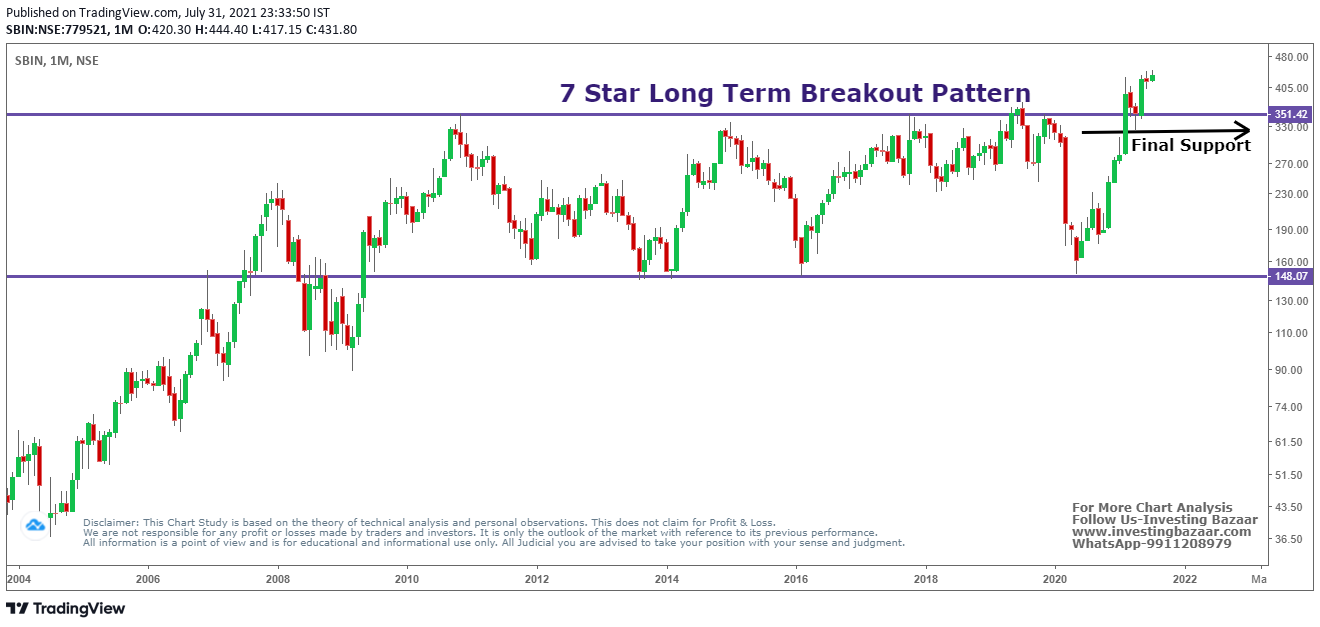
SBI Breakout - 7 Star Long Term Pattern
The Banking Sector's performance is slow compare to other sectors like metal, cement, etc. But if you are thinking to add banking stock in your portfolio then the breakout pattern of SBI i
View Chart...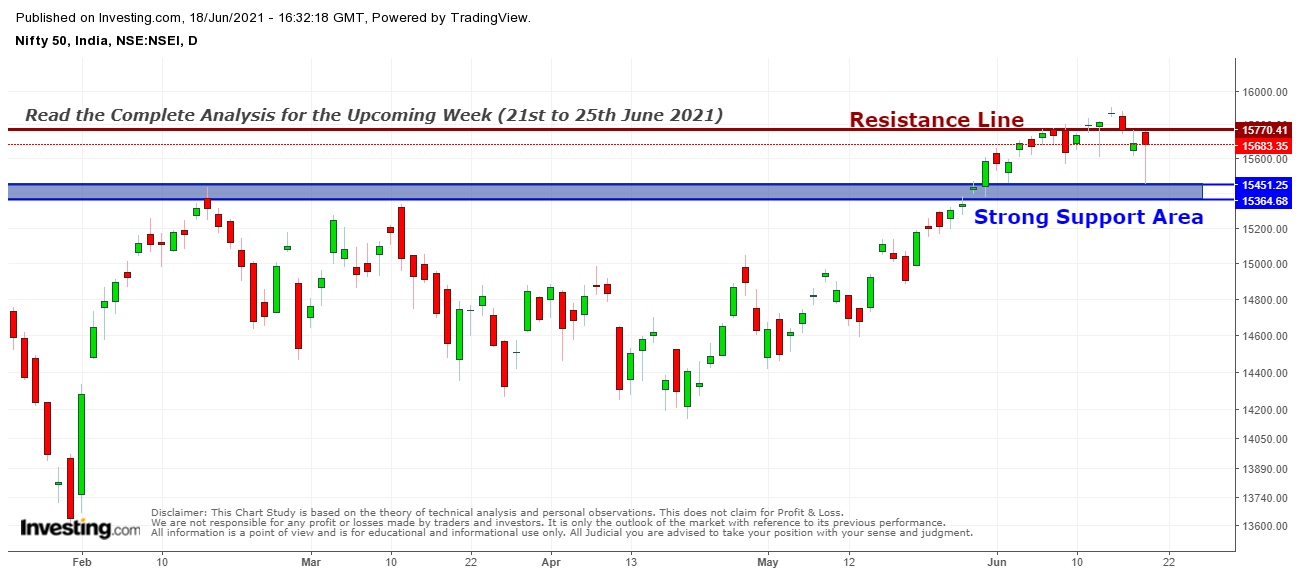
Nifty Premium Analysis For The Upcoming Week ( 21st-25th June, 2021)
As on Friday we saw that Nifty fall sharply in the morning and made a low of 15450 after that a sharp recovery from 15450 up to 15729 means approx 280 points recovery from the low which is
View Chart...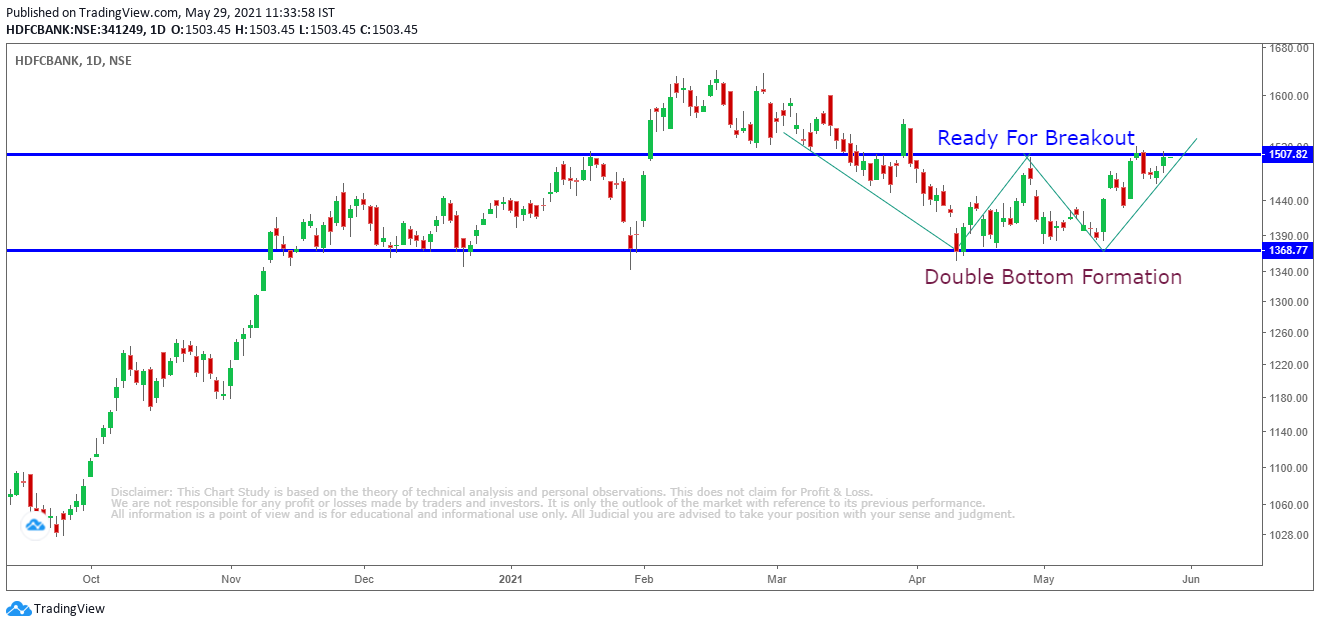
HDFC Bank Chart Analysis - Double Bottom Formation
HDFC Bank formed a double bottom on its support area. Now it is near its breakout if it confirms breakout then a fast move will come towards the upside. So keep watching it. Disclaimer:&
View Chart...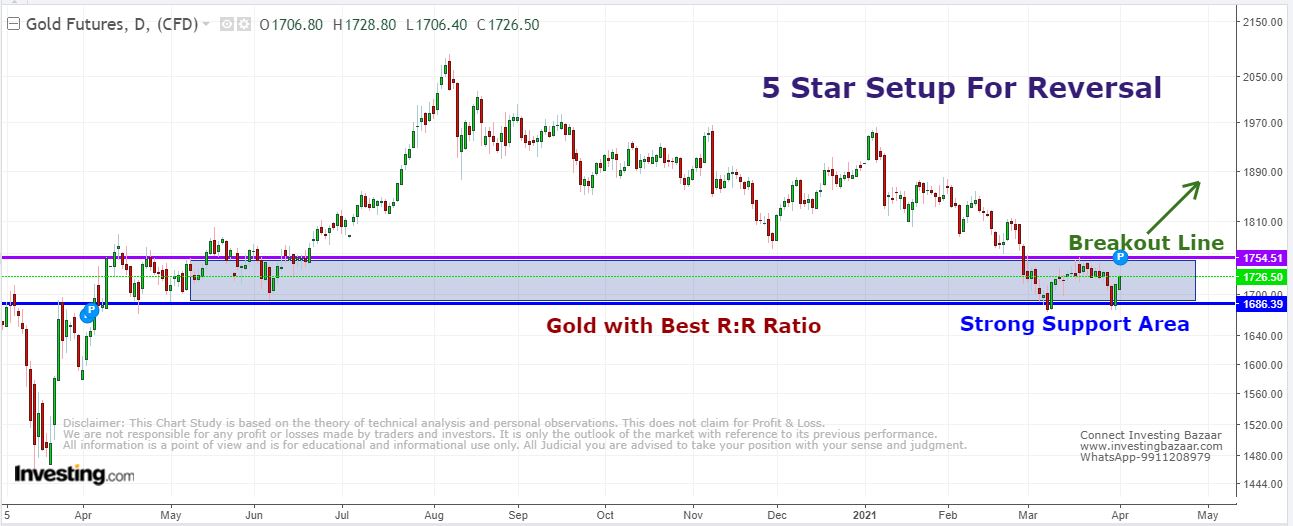
Gold Chart Analysis April Month - Is this Reversal Area for Gold and Should We Invest Now ?
Gold made a high of 2089 Dollar on 7th August 2020 and after that, it is showing a correction up to 1674 Dollar on 8th March 2021 means 7 months correction. And it is working on 1730 Dolla
View Chart...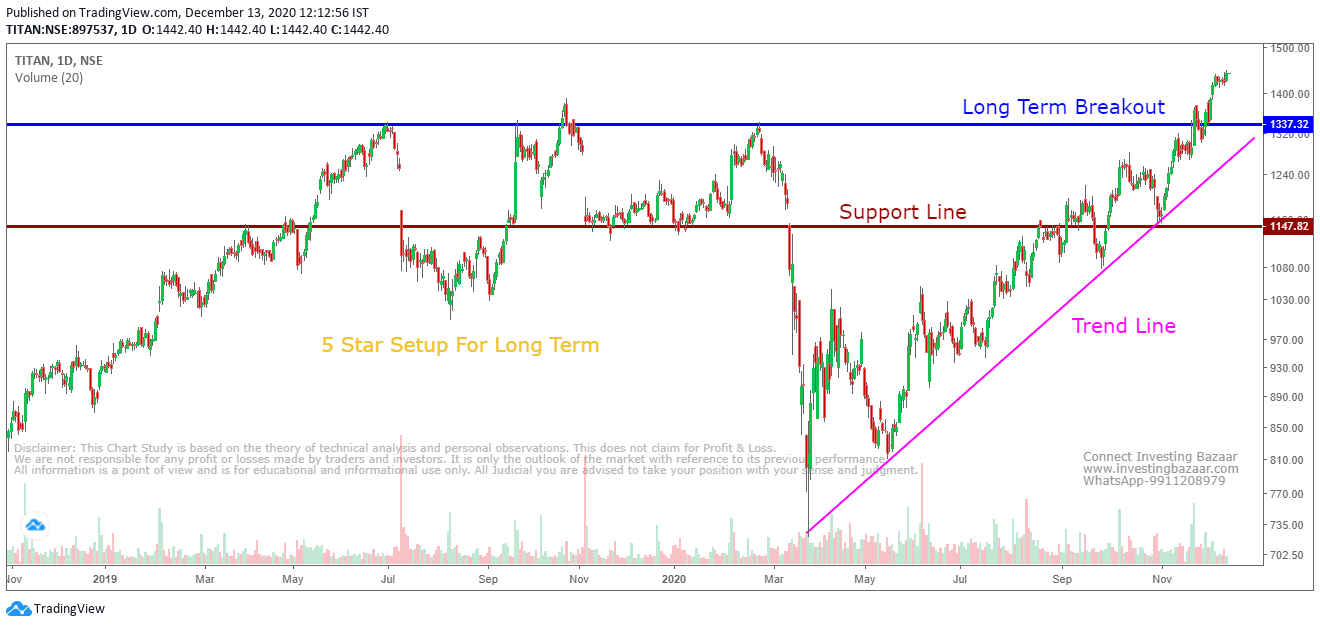
Titan Chart Analysis - 5 Star Setup For Long Term Investment
Titan chart setup is very attractive for long term scenario. As it also a fundamentally strong company with a good history. The current price of Titan is Rs 1442 and long term breakout confirms above 1340 as shown in
View Chart...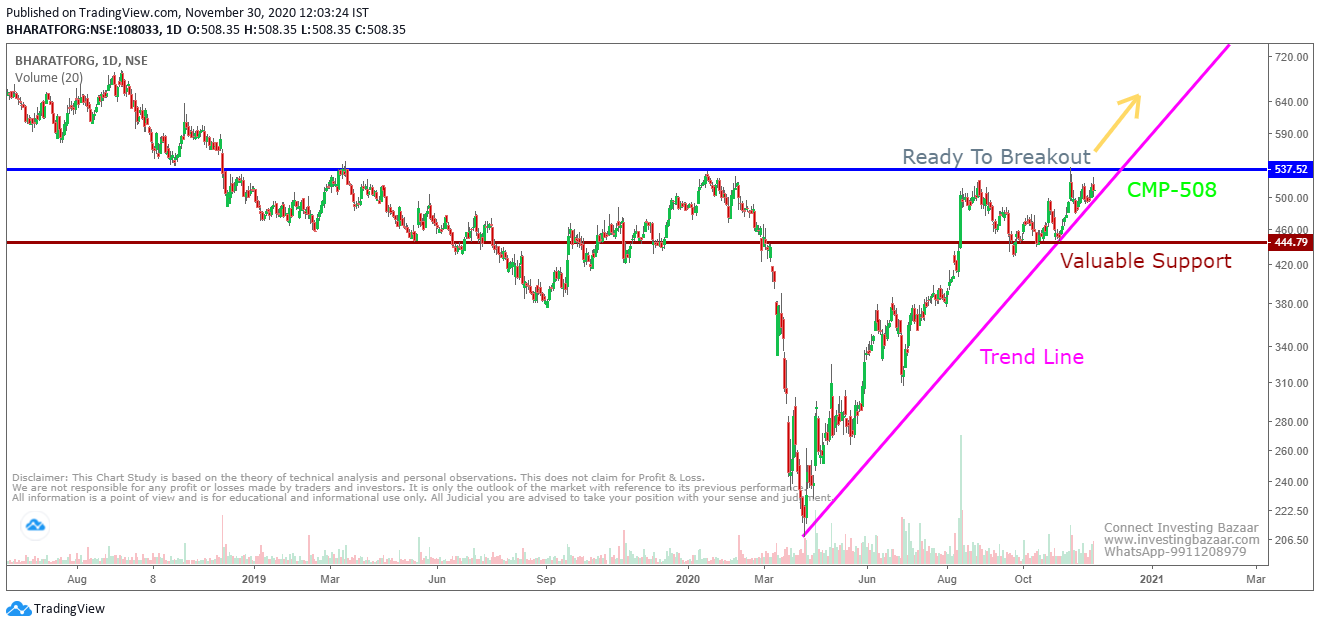
Bharat Forge Chart Analysis - Study For December Series (Analysis Rating-4.8*)
Bharat Forge Chart is looking for a breakout as the current price is Rs 508. Now it has completed its consolidation period whereas Rs 445 is a valuable support area as mentioned in the chart attached above. It should
View Chart...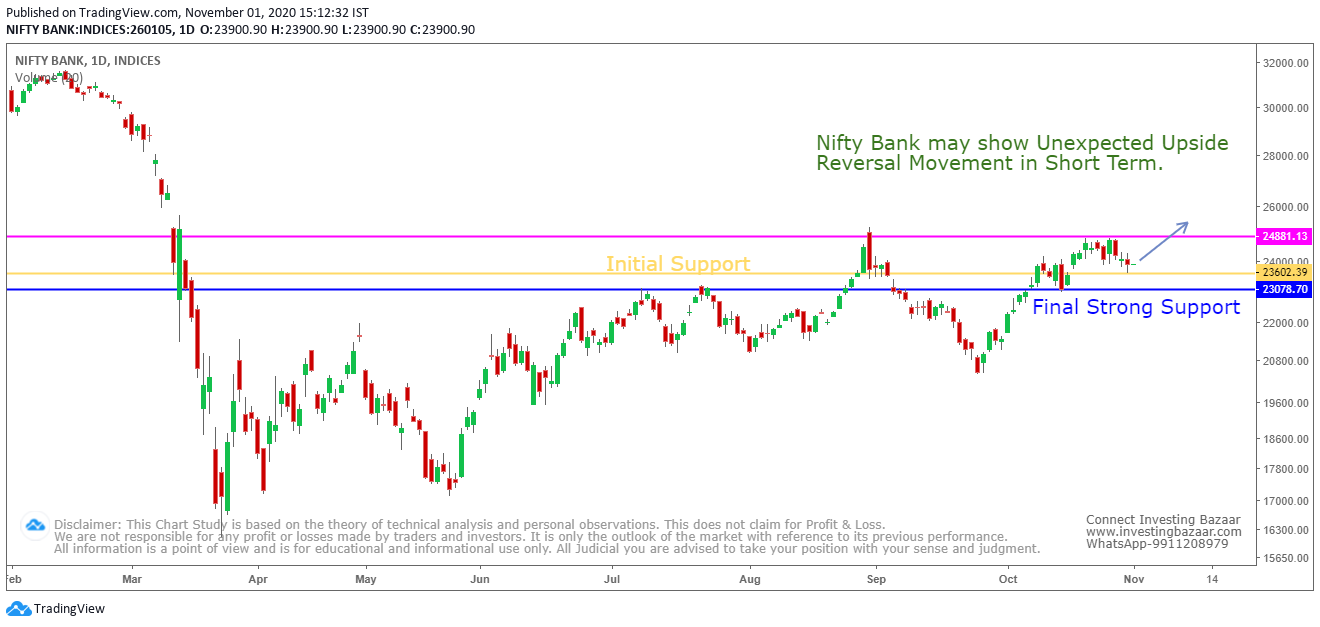
Nifty Bank Analysis - Positive Outlook in November 2020
Market will show high-level tension in the first and second week of November due to various reasons like US Elections and Re-Lockdown in other countries but still, we have to analyze the t
View Chart...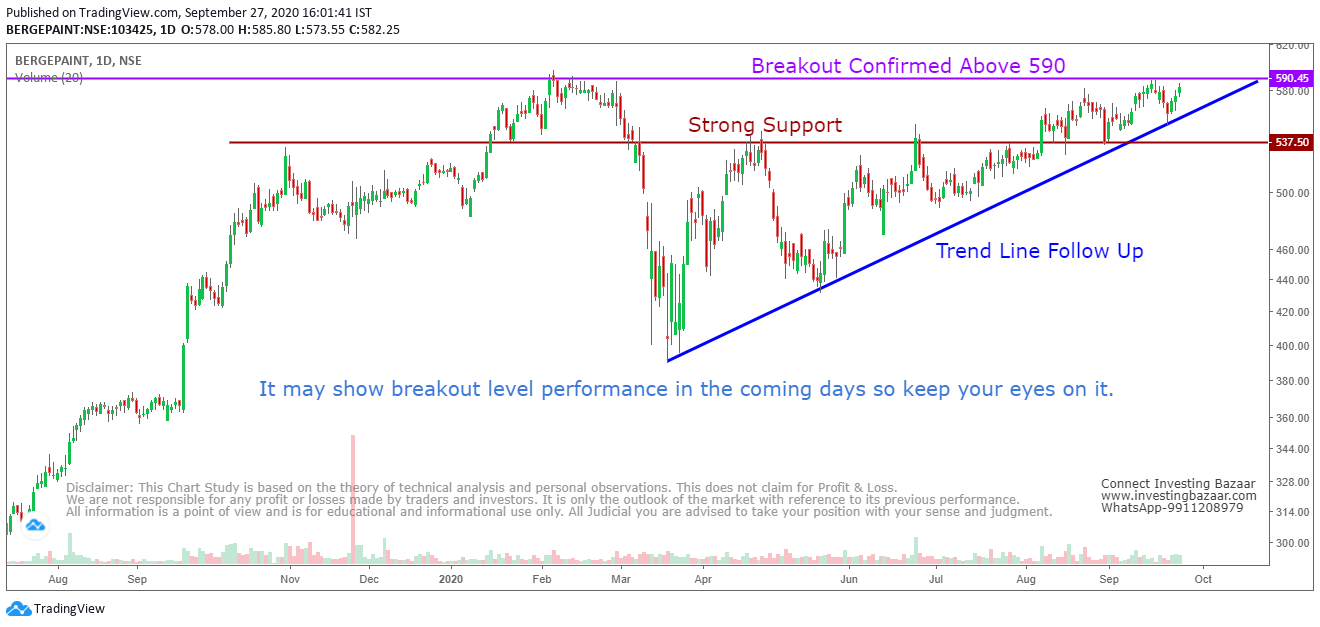
Berger Paint Chart Analysis - Stock Analysis For October Series (Stock Rating 4.5*)
In the Upcoming Weeks, Berger paint may surprise us with a good performance. As per the technical chart given above you will find that it is ready to break out but you have to wait for confirmation and respect the sup
View Chart...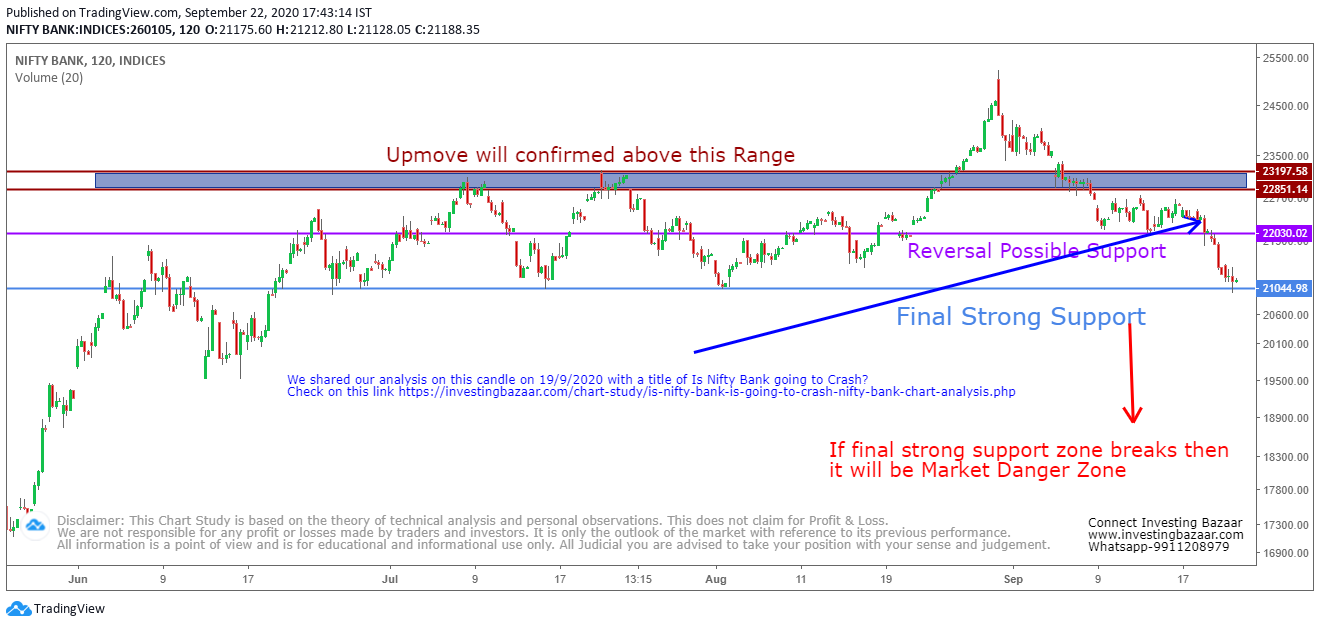
Nifty Bank Analysis Accuracy Result & Future Analysis for September Expiry 2020
As Nifty Bank is underperforming from the last 21 days so on 19/9/2020 we shared a technical chart analysis on bank nifty and showing you the support and other important zones on the chart. Now after two worki
View Chart...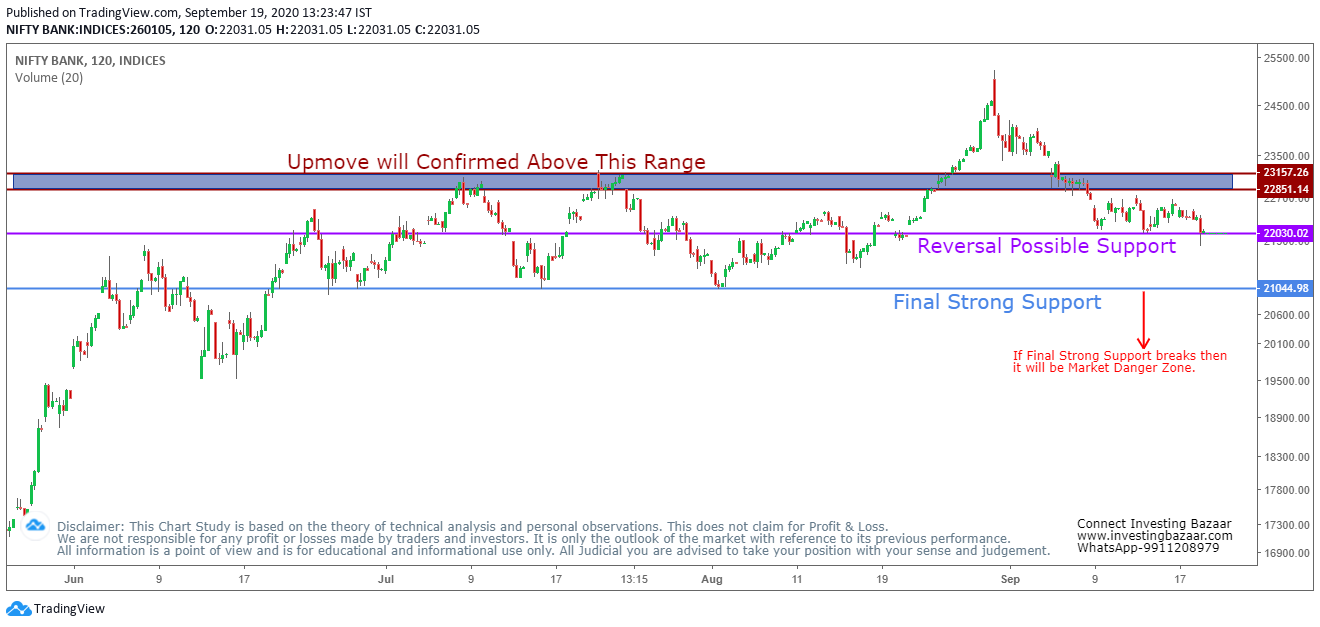
Is Nifty Bank going to Crash? Nifty Bank Chart Analysis
From the last 20 days Nifty Bank is underperforming and continuously breaking all support areas. Last closing of Nifty bank on 22031 levels which an important support area and highly possible reversal point. But the i
View Chart...