Titan Chart Analysis - 5 Star Setup For Long Term Investment
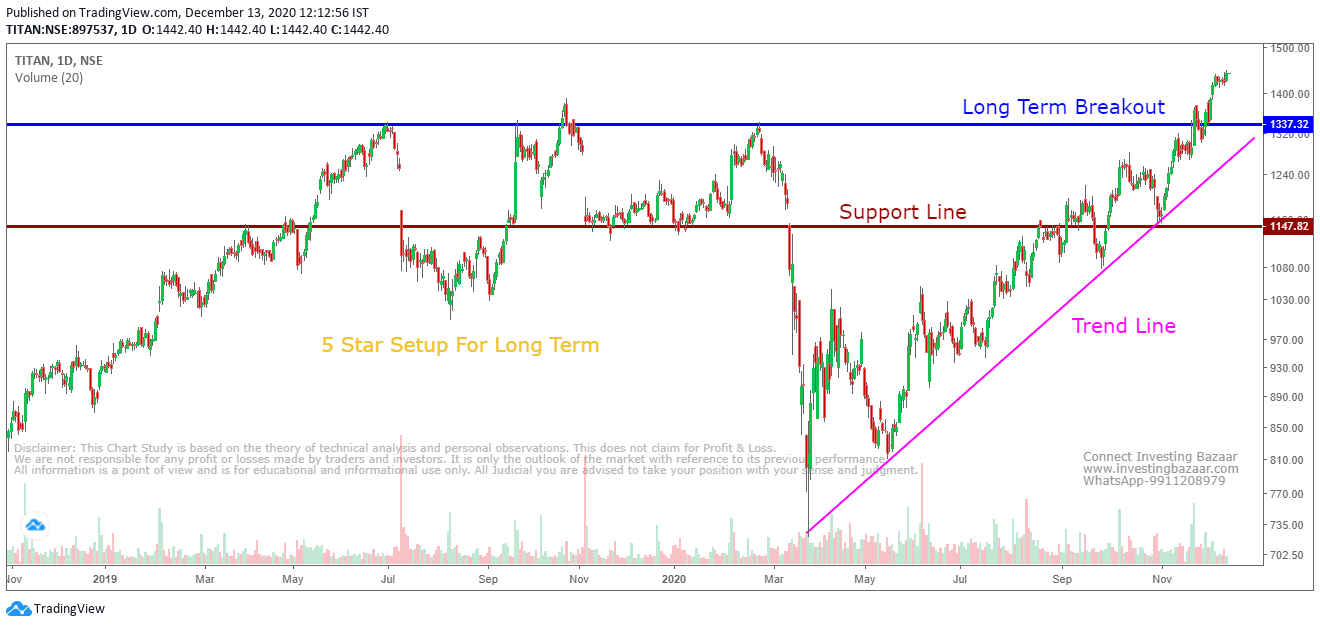
Titan chart setup is very attractive for long term scenario. As it also a fundamentally strong company with a good history. The current price of Titan is Rs 1442 and long term breakout confirms above 1340 as shown in the chart attached above.
This setup shows an all-time breakout with trend line follow up which is a very strong sign for long-term investment. If we talk about support for Titan then we can consider Rs 1150 as a support area as shown in the chart.
Disclaimer: This Chart Study is based on the theory of technical analysis and personal observations. This does not claim for Profit & Loss.
We are not responsible for any profit or losses made by traders and investors. It is only the outlook of the market with reference to its previous performance.
All information is a point of view and is for educational and informational use only. All Judicial you are advised to take your position with your sense and judgment.
For Market Updates and Analysis Follow us Social Media Handles-
Youtube- https://www.youtube.com/c/InvestingBazaar
WhatsApp- +91-9911208979
Facebook- https://www.facebook.com/investingbazaar79/
Instagram- https://www.instagram.com/investingbazaar/
Twitter- https://twitter.com/BazaarInvesting
LinkedIn- https://www.linkedin.com/in/investing-bazaar-8a4b68193/
Like Our Page To Get Blogs & Market Updates